
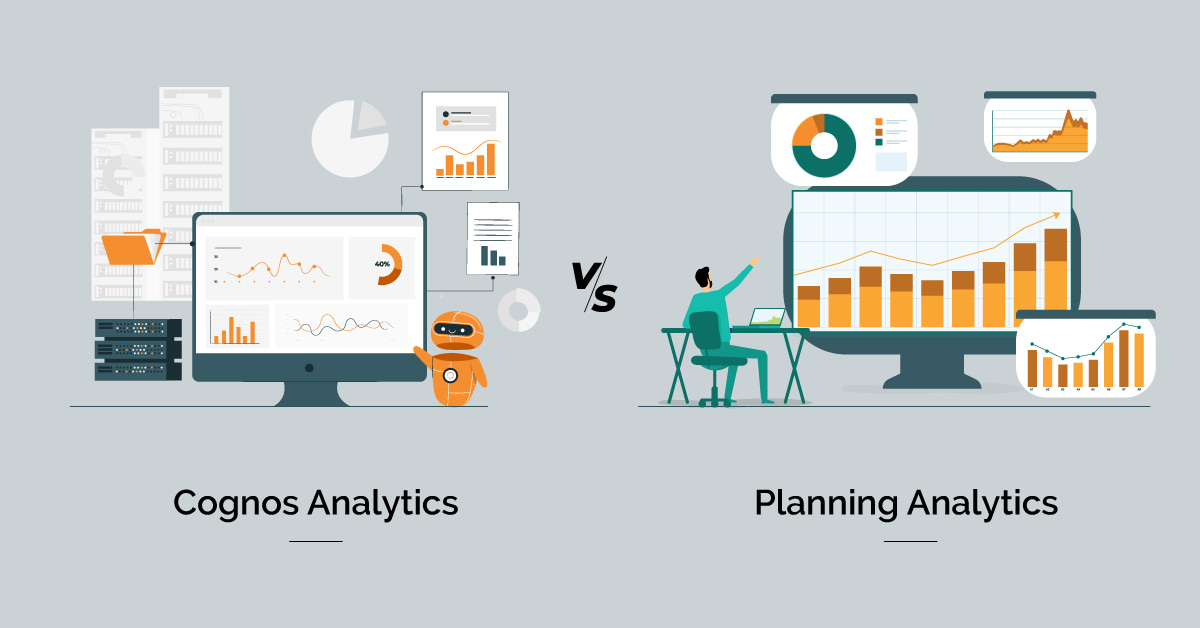
Reporting in Cognos Analytics vs. Planning Analytics
Do you have or plan to purchase both IBM Cognos Analytics and IBM Planning Analytics and wish to integrate them for reporting? If so, you may wonder, “Which tool to use?” It is often overlooked that Cognos Analytics and Planning Analytics can be used for reporting. Each tool has its features and significance. This guide will help you understand the difference and which is best per your requirement.
Reporting in Cognos Analytics vs. Planning Analytics
- 1. IBM Cognos Analytics- Overview
- 2. IBM Planning Analytics- Overview
- 3. IBM Cognos Analytics: Offering Endless Possibilities
- 4. IBM Planning Analytics: Offering Interactive Workspace
- 4. A Quick Insight into the Difference between IBM Cognos Analytics on Cloud and IBM Planning Analytics
- 5. Conclusion
IBM Cognos Analytics- Overview
Cognos Analytics help to report, model, manage, and analyze data on a single platform. It offers a unique analytics experience with advanced data exploration features, storytelling, dashboarding, automated data preparation, and professional report authoring.
Delivered in a highly secured and single-integrated platform, Cognos Analytics allows companies’ labor to work and explore all types of data for effective decision-making.
IBM Planning Analytics- Overview
In today’s unpredictable working environment, companies need foresight, agility, and speed in their operational and financial performance management. IBM Planning Analytics offers all three features.
IBM Planning Analytics help to automate forecasting, analysis, budgeting, and planning processes. It allows finance and line of business users to coordinate their planning, linking key company drivers to financial KPIs.
Let’s Explore the Features of Cognos Analytics and Planning Analytics for Reporting
IBM Cognos Analytics: Offering Endless Possibilities
- Cognos reports:
- Static reports: Appropriate for fixed format reports where you cannot change the format or the data. It can emerge in URLs or other apps or as reporting on demand, both offline and online usage.
- Interactive reports: Offer you a beginning point from where you can explore. It is designed for full interactivity and has the same abilities as static reports.
- Personalized reports: You can apply filters to study and check information that meets your needs. Include or exclude data, group, pick up the pencil and make edits like subscribing to static or adding calculations.
- Ad hoc reports: Data experts can edit and author ad hoc reports depending upon their skill level and then move to a high experience person to refurnish and standardize. It can be built from the “+” or “CREATE” menu as a “report” or “dashboard.”
- Storytelling: It enables users to present their thoughts directly with Cognos Analytics in a very engaging and dynamic manner. Several story arcs are accessible, and dashboards provide visualizations that can be pinned for use. Functions such as text animations, instant infographics, animation options, and intelligent naming in pins and timelines are also available.
- Dashboards are the next stage of self-service, wherein you can start to develop from a blank canvas. The dashboard is a fantastic feature to begin your demo to illustrate how you can bring data to life and begin to explore using a few clicks. IBM Cognos tool is highly effective for monitoring and improving performance.
- Uploaded files: It is easy to upload a spreadsheet into Cognos Analytics and start merging it for stories or dashboards. With few data formats, providing data to a central data warehouse is unnecessary. It may be transient such as monthly survey data or upload file option.
- Data models and professional reports: A robust modeling software known as a framework manager provides complete flexibility and row-level security. It is ideal for users who must create standardized production reports and pre-built data models across the organization to utilize this as their official sanctioned sources.
- Offline messages: IBM Cognos Analytics helps to access accounts in a disconnected mode or to provide information to those who do not hold licenses. They are commonly predefined, interactive, and professionally authored. Reports are dispersed through email or pulled from a network location.
- Scheduled reports: They provide production reports using a visual of how you can build up a scheduled report. Organized facilities such as recurring frequency, date and time, delivery options, format, language, and prompts allow automation of insights to run the company effectively.
IBM Planning Analytics: Offering Interactive Workspace
- Multidimensional analysis: IBM Planning Analytics allows multifaceted analysis of future-based, historical, and large data sets. It emerges from several data sources and allows a comparative evaluation of data from all relevant systems. You can conduct detailed dimensional analysis and calculations such as price or volume variance, product, and customer profitability.
Moreover, IBM Planning Analytics clarifies the administration and maintenance of planning frameworks and scenario-based hierarchies. - Data discovery and predictive power: It helps users identify new insights directly from your data. Depending on general business terms, natural language, and data exploration queries allow you to work with your data and perform quickly via analysis. Automated visualization with compelling and clear graphics assists you in sharing outcomes with decision-makers.
Dashboards and scorecards help companies monitor and measure performance concerning specific roles and functions. - Advanced self-service modeling allows everyday business and financial analysts to develop and maintain advanced plans and forecasts with little to no IT support. IBM Planning Analytics allows dimensional calculations and analysis for the most demanding profitability and scenario models. It builds models which integrate virtually any company drivers into forecasts, budgets, and plans.
- Scorecards and dashboards: You can design role-based scorecards and dashboards related to budgets and plans. You can share them across all departments of an organization. They help to monitor and measure performance which in turn helps drive strategy management and execution by enabling align actions, resources, and initiatives with corporate objectives.
A Quick Insight into the Difference between IBM Cognos Analytics on Cloud and IBM Planning Analytics
- With respect to features:
Cognos Analytics with Cloud has access control, analytics & reporting, governance & policy management, and report generation features. IBM Planning Analytics is famous for its features such as analytics & reporting, dashboard and visualization, budgeting, and forecasting.
While comparing both tools, a business must look for features such as ease of use, customization, customer support, scalability, etc. - With respect to deployment type:
Cognos Analytics with Cloud supports web-based deployment. IBM Planning Analytics is appropriate for web-based deployment.
While comparing both BI tools, a business needs to determine which of the two instruments is compatible with your device. This means that the tool help in decreasing hassle once implemented. - Which is ideal for your industry:
Suppose you cannot decide between IBM Cognos Analytics with Cloud and IBM Planning Analytics. In that case, you can determine if the tool has customizable modules or features per your industry. Industry-specific features help to ensure higher ROI and efficiency. Therefore, also check for any hidden price involved.
Conclusion
We have studied the features and differences between Cognos Analytics and IBM Planning Analytics. While IBM Cognos Analytics offers several customized features, IBM Planning Analytics has several diverse modules. Select between Cognos Analytics and Planning Analytics per your business needs and demands, as both tools provide great opportunities and drive business performance.


More on Technology
Innominds and Qualcomm Collaborate to Drive Enterprise Digital Transformation with High-Compute Edge AI Platform
-
Team Eela