
Which One is Better: IBM Cognos or any Other BI Reporting Tool?
Often, information about the current state of your company is not sufficient. Knowing past trends and today’s development remains crucial. But understanding what is going to happen in the future helps your business stay ahead of the competition. Thankfully, business intelligence reporting tools today include predictive business analytics along with descriptive BI. Looking for a reliable BI reporting tool? We’ve got you covered.
Which one is better: IBM Cognos or any other reporting tool?
This blog compares three BI reporting tools, IBM Cognos Vs Power Bi Vs Tableau that include predictive, descriptive, and other advanced analytics features. Let’s start with the basics.
IBM Cognos Overview
IBM Cognos is a business intelligence and analytics solution that enables organizations to analyze, visualize, and distribute information across the enterprise. It provides a range of features including reporting, dashboarding, score carding, analysis, and planning to help organizations make better decisions and improve performance.
IBM reporting software is designed for a wide range of users including business analysts, financial analysts, data scientists, and IT professionals. It offers a user-friendly interface that allows users to easily access and analyze data, create reports and dashboards, and collaborate with others in the organization.
Power BI Overview
Power BI is a business analytics tool by Microsoft that allows users to analyze, visualize, and share data across their organization. It offers a range of capabilities including data modeling, data analysis, interactive visualizations, and custom reporting to help organizations make data-driven decisions.
Power BI is user-friendly and accessible to a broad range of users including data scientists, business analysts, and executives. It allows users to connect to a variety of data sources, including cloud-based and on-premises data sources, and create interactive visualizations and reports using a drag-and-drop interface.
Tableau Overview
Tableau is a powerful and widely used business intelligence and data visualization software that helps users to analyze and visualize data easily and quickly. It allows users to connect to and combine data from multiple sources, including spreadsheets, databases, cloud-based services, and big data platforms, and then create interactive and visually appealing dashboards and reports.
Tableau offers several visualization options, including charts, maps, tables, and graphs, which allow users to explore data and identify patterns and insights. Tableau also offers collaboration features that allow users to share data and visualizations with others, whether that be through live dashboards or static reports
IBM Cognos Vs Power BI Vs Tableau- A Detailed Comparison of BI Reporting Tools
BI reporting tools comparison based on key features can help you understand which tool will help you move towards your business goals easily.
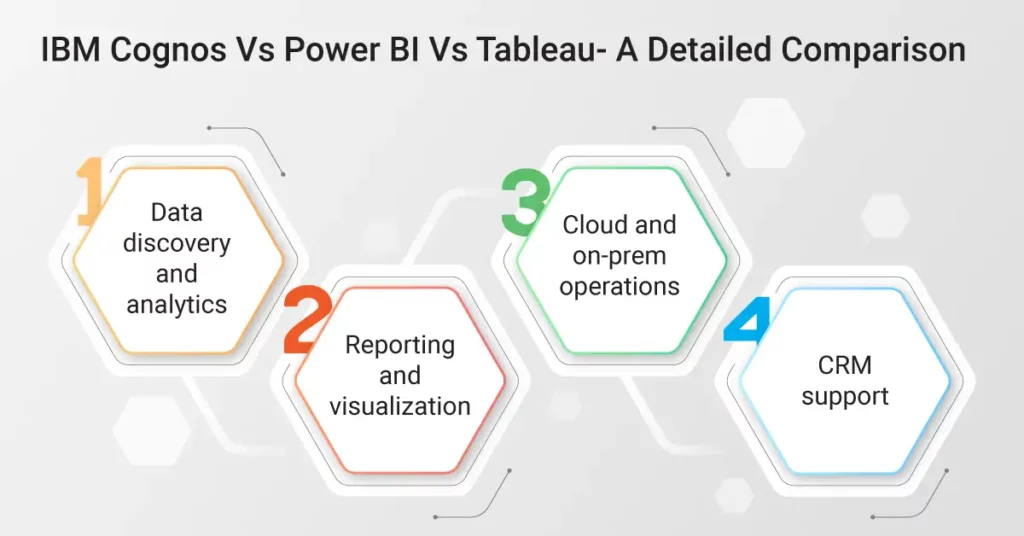
1. Data discovery and analytics:
- IBM Cognos: IBM Cognos analytics tool allows you to connect to a diverse range of data sources, including spreadsheets. The software provides tools to automatically join multiple data sources providing more robust insights. The AI Assistant tool uses plain language to communicate, enabling you to ask questions about your data and receive easily understandable recommendations.
- Power BI: With Power BI, it is possible to connect to numerous cloud-based and on-premises sources. You can access the latest data from Dynamics 365, Salesforce, Azure SQL DB, Excel, and SharePoint using automated incremental refreshes. To prepare data more quickly, there are data modeling tools available. You can use the self-service Power Query, which many Excel users are familiar with, to rapidly transform, integrate, and enrich your data. Other features include quick measures, forecasting, grouping, clustering, and advanced modeling with DAX formula language.
- Tableau: Through its richer abilities based on the patented VizQL engine, it tries to differentiate itself from what it explains as an intuitive analytics experience. It can connect with in-memory and live data. Tableau allows users to control performance, cost, and data freshness. It scores exceptionally well on live query extracts and capabilities, supporting analysts to resolve queries quickly.
2. Reporting and visualization:
- IBM Cognos: IBM Cognos dashboards offer an extensive selection of visualizations like geospatial mapping and advanced analytics. Interactive dashboards enable you to drill down, move up, or navigate horizontally through the visuals, with real-time updates that display your selected data. Collaboration is possible by sharing your reports and dashboards through email or Slack, and you can also export reports in several formats and deliver them to stakeholders on a scheduled basis.
- Power BI: Power BI enables you to produce reports with dynamic visualizations that allow for user interaction. You can create your visuals through an open-source custom visuals framework or the drag-and-drop canvas with pre-built solutions from Microsoft and its partners. With a range of themes, formats, and layouts available, you can customize your report to meet your specific needs. Reports can be shared in mobile-optimized formats or embedded in existing apps or websites.
- Tableau: It offers a broad variety of graphs to provide effective data visualizations. The visualizations that you can create are based on the data properties such as categorical continuous, and the company problems that you are trying to resolve. Although, there is no standard rule as to which chart type should be used with what type of data, as it is the creator’s choice of how they wish to highlight their visualizations.
3. Cloud and on-prem operations:
- IBM Cognos: It offers both cloud and on-prem versions. Although, their advanced data analytics functions are only accessible on the on-prem operations. Today, IBM Cognos is constantly updating its cloud operations to make them more effective.
- Power BI: You can use the SaaS version of Power BI on the Azure cloud system for streaming analytics, live interactive dashboards, and automated alert systems. They do have an on-prem version, but it is not effective as the cloud version.
- Tableau: It provides cloud-hosted solutions like Tableau CRM and Tableau Online and their capabilities on the on-prem deployments and their massive installed base resides here only.
4. CRM support:
- IBM Cognos: It is not specially developed for CRM, but you can use it along with third-party software.
- Power BI: It works seamlessly with Microsoft Dynamics CRM.
- Tableau: It provides excellent enterprise products and marketing abilities and is owned by Salesforce.
IBM Cognos Vs Power BI Vs Tableau- Conclusion
As you have seen, there are a few differences between the three BI reporting tools discussed. With every new feature, the functionality gap will increase or decrease in response to the other BI tool. Some of these features are just preferences and others often are not crucial to your business goals and processes. Overall, while choosing the best BI tool for your organization compare all the features of the tool with respect to your needs.