
Top IBM Cognos Analytics Likes & Dislikes 2023

IBM Cognos is the 3rd ranked solution in the top legacy BI Tool’s listing, 3rd ranked solution in top Reporting Tools, and 4th ranked solution in top Business Intelligence Tools.
What is IBM Cognos?
IBM Cognos is a Business Intelligence tool that offers a broad variety of features that enables us to analyze organizational data. Cognos reporting allows companies to monitor metrics and events, design, view business reports, and evaluate data to assist them to make informed and effective decisions.
IBM Cognos uses different strategies to describe, compare, and summarize data, and form data-driven conclusions. It enables users to discover variances or anomalies and observe trends that may not be visible otherwise. Data sources contain information from different sections of an organization which can be stored in different packages. Depending upon their specific role or group, a user can see only the data to which they have been granted access.
Insight into Common IBM Cognos BI Functions
Some of the key functions of IBM Cognos BI include:
- Reporting: It offers a powerful reporting engine that allows us to create customized reports in a variety of formats, including PDF, Excel, and HTML. The reports can be designed using a drag-and-drop interface and can include charts, graphs, and tables.
- Analysis: Cognos reporting tools for ad-hoc analysis allow users to explore data in a self-service manner. The analysis can be performed using a web-based interface, which makes it easy for users to work with data from any location.
- Dashboards: You can create interactive dashboards that provide a real-time view of key performance indicators (KPIs) using the Cognos reporting dashboarding tool. The dashboards can be customized to meet the needs of specific users or departments.
- Scorecards: Scorecards help organizations to align their strategies with their goals and objectives. IBM Cognos provides a visual representation of key metrics and can be used to track progress over time.
- Data Integration: It helps companies to combine data from multiple sources into a single data warehouse. The data can be transformed and cleansed to ensure that it is accurate and consistent.
- Collaboration: IBM Cognos BI includes tools for collaboration, which allow users to share reports, analyses, and dashboards with other users. The collaboration features make it easy for users to work together on projects and share information.
Pros and Cons of IBM Cognos Reporting Tool
Pros:
- IBM Cognos is known for its powerful reporting and analytics capabilities, which allow businesses to gain insights from their data.
- The software is highly customizable, with a range of features and tools that can be tailored to suit specific business needs.
- Cognos reporting tool has a user-friendly interface, which makes it easy for users to create and share reports and dashboards.
- The software is scalable, which means it can be used by businesses of all sizes, from small startups to large enterprises.
- IBM Cognos is built on a robust architecture that is designed to handle large volumes of data and support complex reporting and analysis. It is an integrated solution that can be deployed in the cloud and on-prem.
- Security enables opportunities to share aggregate data across the organization within teams easily and securely.
Cons:
- Some users have reported that the software can be complex to set up and configure, which can make it difficult to get started with.
- The cost of IBM Cognos can be high, especially for small businesses or startups with limited budgets.
- The software may require specialized skills and expertise to use effectively, which could be a barrier for some businesses.
- While the user interface is generally user-friendly, some users have reported that certain features can be difficult to find or use.
- IBM Cognos may not be as intuitive or user-friendly as some competing business intelligence software products.
IBM Cognos Analytics with Watson
Cognos Analytics is an AI-based business intelligence platform that assists the lifecycle of analytics from discovery to operationalization. Cognos reporting tool users- starting from business analyst, and data scientist, to a non-specialist- gets more power to conduct relevant analysis in a manner that links back to companies’ goals and objectives.
It focuses on shortening every user’s lifecycle from simple to sophisticated analytics enabling them to tackle data to examine the unknown, understand challenges and outcomes, and identify new relationships. Cognos Analytics with Watson enables you to visualize, share, and analyze actionable insights regarding data with anyone in the company.
Features of IBM Cognos Analytics with Watson
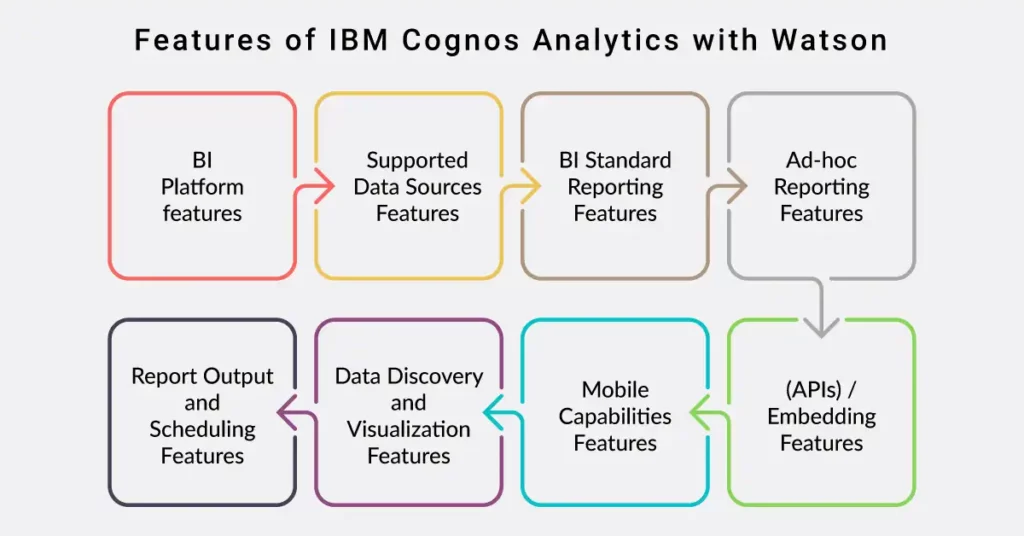
1. BI Platform features
- Administration via Web Interface
- Live Connection to External Data
- Snapshot of External Data
- In-memory data model
- OLAP (Pre-processed cube representation)
- Multi-Data Source Reporting (Blending)
- ETL Capability
- ETL Scheduler
2. Supported Data Sources Features: Data sources that can be used by the application.
- MS Excel Workbooks
- Text Files (CSV, etc.)
- Oracle
- MS SQL Server
- IBM DB2
- MySQL
- ODBC
- Cloudera Hadoop
- IBM Netezza
- SAP Hana
- Salesforce
- SAP
3. BI Standard Reporting Features: It means canned and pre-built reports are accessible to users without having to create them.
- Pixel Perfect reports: They are highly formatted reports with graphics and functions to preview the report before printing.
- Customizable dashboards: They are dashboards providing the builder some degree of control over the look and feel and display options.
- Report Formatting Templates
4. Ad-hoc Reporting Features: Ad-Hoc Reports are reports built by the user to meet highly specific requirements.
- Drill-down analysis: It is the ability to get to a further level of detail by going deeper into the hierarchy.
- Formatting capabilities: Ability to format output. For instance, conditional formatting, lines, headers, and footers.
- Predictive modeling: Helps to build future forecasting models.
- Integration with R or other statistical packages
- Report sharing and collaboration
5. Report Output and Scheduling Features: Power to schedule and manage report output.
- Publish to PDF
- Output Raw Supporting Data
- Report Delivery Scheduling: To have reports delivered to a destination at a specific date and time.
6. Data Discovery and Visualization Features: It refers to the analysis of multiple data sources in a search for patterns and outliers and the ability to represent the data visually.
- Pre-built visualization formats (heatmaps, scatter plots, etc.): They are canned visualization types that can be selected to visualize various kinds of data.
- Location Analytics / Geographic Visualization
- Predictive Analytics helps to build forecasting models based on existing data sets.
- Support for Machine Learning models is defined as the computer programs that can learn when exposed to new data.
- Pattern Recognition and Data Mining refer to the potential to recognize hidden patterns in enormous quantities of data.
- Integration with R or other statistical packages
7. Access Control and Security Features: Helps to determine who has access to which data
- Multi-User Support Named model which means users have access based on name and password
- Role-Based Security Model that helps to determine the data by job or position in the corporation.
- Multiple Access Permission Levels (Create, Read, Delete) mean that different levels of users have various rights.
- Report-Level Access Control is elaborated as the type of report determines who has access to it.
- Table-Level Access Control (BI-layer)
- Field-Level Access Control (BI-layer)
- Single Sign-On (SSO) allows you to use one set of login credentials to access multiple applications
8. Mobile Capabilities Features: Support for mobile devices like smartphones and tablets.
- Responsive Design for Web Access: Web design aimed at producing easy-to-read sites across a range of different devices.
- Mobile Application: A dedicated app for iOS and/or Android.
- Dashboard / Report / Visualization Interactivity on Mobile
9. Application Program Interfaces (APIs) / Embedding Features: APIs are a set of routines, protocols, and tools used for embedding one application in another.
- REST API REST is an architecture style for designing networked applications
- Java Script API
Bottom Line
Overall, IBM Cognos BI is a comprehensive suite of tools that provide organizations with the functionality they need to manage their data, analyze their performance, and make informed decisions.