More on Technology
Innominds and Qualcomm Collaborate to Drive Enterprise Digital Transformation with High-Compute Edge AI Platform
-
Team Eela
According to a report in Social Media Today, 2.5 quintillion bytes amount of data are created every day. The amount of data generated daily around the world will reach 463 exabytes by 2025, according to a report by the World Economic Forum.
In light of so much data, what do you think of our ability to cope with it – after all, data is essential to a business’s success. Several trending data analytics tools in the market today help you gather insights from data.
This blog explains the top 10 data analytics tools list in 2023 you can use. But before we get there, let’s take a quick look at what open-source analytics tools are and what benefits they can offer.
The most basic definition of a data analytics tool is a program or software that performs data analysis. These tools help you collect and analyze data to gain insight into your business, customers, and competitors.
Regarding the benefits of trending data analytics tools, several features and capabilities enable users to make sense of data on all levels and make sense of them.
Trending data analytics tools can provide you with many benefits, some of which are as follows:
Here is a list of the best data analytics tools list in 2023 that you can follow for adding intelligence to your business processes:

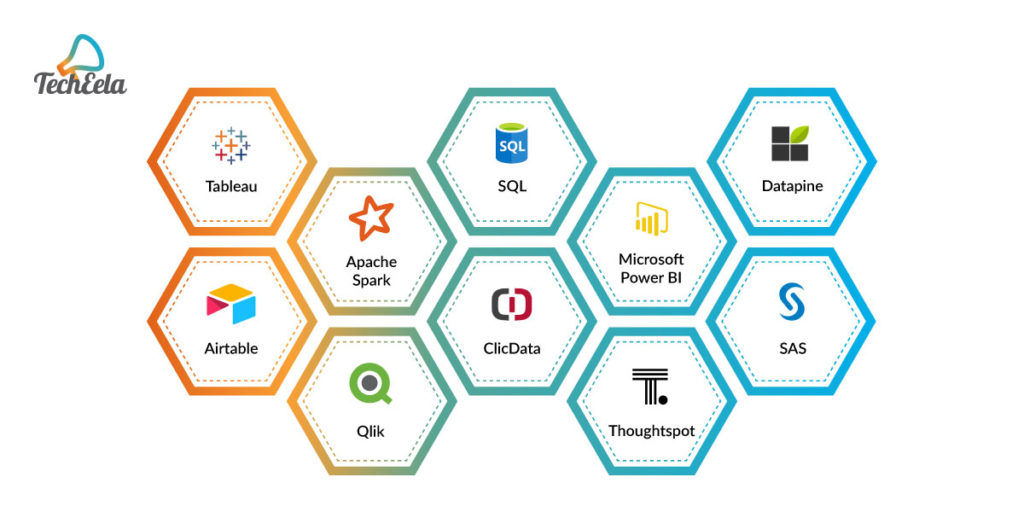
Tableau is the top data analytics tool in the world that is most well-known for making successful business forecasts, decisions, and strategies based on data.
This tool is primarily intended to help people visualize and understand data more clearly. Visual analytics capabilities of the tool transform how people use data to solve problems.
Now that Tableau is part of Salesforce; it will become more powerful. Having Tableau and Salesforce together allows for CRM analytics, resulting in more innovative work, faster trend spotting, and more accurate predictions.
SQL translates to Standard Query Language.
SQL is one of the most efficient free data analysis and visualization tools. The primary benefits of SQL include the capability to access, clean, and analyze data stored in databases.
The best part about SQL is that it gives you an easy learning curve, yet it is one of the leading technologies used by the world’s largest companies to solve complex data analysis challenges.
Datapine can be referred to as an Interactive BI dashboard to help you access all your company’s data and make data-driven decisions regardless of your domain or size of business.
A predictive analytics forecast engine is the core feature of Datapine, which analyzes data from multiple sources integrated with their various data connectors.
Through Datapine’s self-service analytics tools, employees can explore their data and find relevant insights based on it. For those experienced with data analysis, the advanced features will allow them to dig deep into various data.
Apache Spark is one of the most successful open source data analytics tools. Python, SQL, Scala, Java, or R can process your data in batches and live streaming, unified in one environment.
In addition to being easily integrated with a wide range of frameworks, Apache Spark helps develop data analytics, business intelligence, machine learning, storage, and infrastructure systems.
Data analytics tool Microsoft Power BI allows you to create interactive reports and visualize data in real-time using visual analytics.
It combines Power BI’s comprehensive features with other Microsoft Power Platform products, including Microsoft 365, Dynamics 365, Azure, and hundreds of other apps, to create end-to-end business solutions.
Airtable is another name in our top data analytics tools list. A robust database is combined with its data analysis and visualization functions (similar to other traditional spreadsheet tools), so you can analyze the results.
Among the most talked about features of Airtable is the ability to design custom interfaces based on your requirements. In this way, all team members are provided with the information they need and a simple way to act upon the information given to them.
ClicData is an end-to-end business analytics tool that can create beautiful and interactive dashboards that can be shared automatically and connect data from more than 250 sources into one data warehouse.
The tool facilitates a data-driven approach, which gives data-driven teams access to any data and allows them to visualize it in an agile and innovative manner. The warehouse offers a single source of truth and allows more intelligent data visualization.
SAS has carved a name for itself as an industry pioneer in data analytics software. In addition to offering reality-tested AI, the software provides resilience against uncertainty, reliable results, and empowerment at all levels.
The SAS Platform is powerful enough to allow you to quickly understand what is happening now, predict how and when to pivot seamlessly and drive your progress forward.
The only cloud platform built for Active Intelligence, Qlikenables you to bring data, insight, and action together. Qlik is a tool that allows you to analyze your data and analytics in real-time, AI-driven, collaboratively, and actionably.
A key feature of Qlik is its in-memory data processing, ensuring superfast results, coupled with easy-to-understand visualizations of color-coded data relationships.
With Thoughtspot, searches and views are based on reports and natural language queries, allowing users to access data from various sources. Using this tool, the data leaders can harness the power of cloud-based business data in a very effective way to maximize their data’s value.
By facilitating the automatic joining of tables from different data sources, the data analytics platform helps users eliminate data silos.

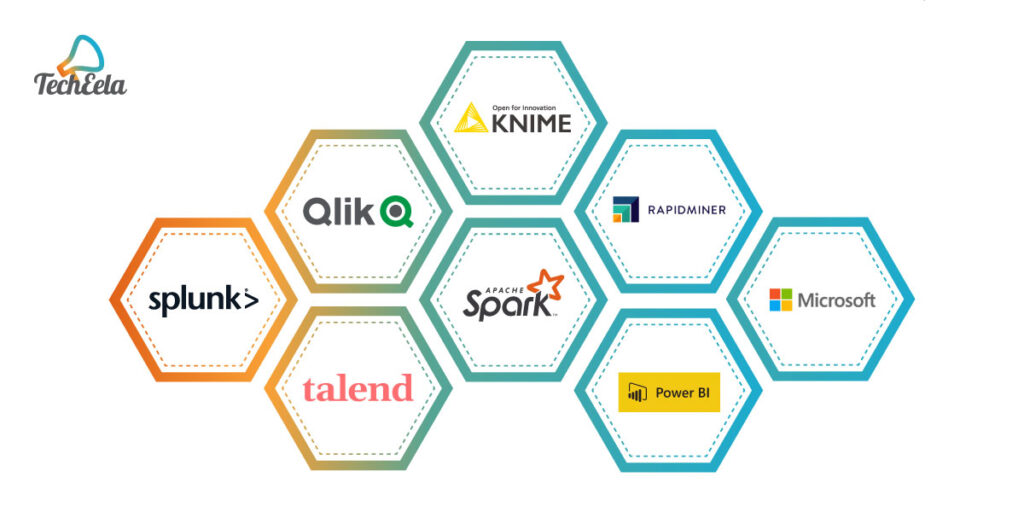
Splunk is a platform for searching, analyzing, and visualizing machine-generated data acquired from various apps, websites, etc. Splunk has created products for multiple markets, including IT, security, analytics, DevOps, and security. As a result, Gartner named it a Visionary in the 2020 Magic Quadrant for APM.
Splunk was developed to help teams detect and diagnose issues with unmistakable visibility, explore and visualize business processes, and streamline the entire security stack. Its goal is to bring data to every area of your organization because almost all businesses must deal with it across various divisions.
Talend was created on the Eclipse graphical programming environment and is one of the market’s most powerful data integration ETL technologies. It seeks to provide everyone with compliant, usable, and clean data. This solution allows you to manage each step of the ETL process efficiently and was named a Leader in Gartner’s Magic Quadrant for Data Integration Tools and Data Quality Tools for 2019.
Talend has recently sped up the path to the lakehouse paradigm and the process of revealing intelligence in data. Additionally, the Talend Cloud is currently accessible through the Microsoft Azure Marketplace.
QlikView is a self-service business intelligence, data visualization, and analytics software tool. With capabilities like Data Integration, Data Literacy, and Data Analytics, it promises to hasten the value that data can offer enterprises as a leader in Gartner’s Magic Quadrant 2020 for Analytics and BI platforms.
Recently, QlikView introduced Qlik Alerting for Qlik Sense®, an intelligent alerting platform that aids organizations in handling exceptions, warns users of potential problems, assists users in other data analysis tools, and prompts actions based on the gleaned insights.
The Apache Software Foundation’s most well-known project, Apache Spark, is an open-source framework for real-time processing on cluster computing. It features a beautiful open-source community and programming interface and is now the most active Apache project. Implicit data parallelism and fault tolerance are ensured via this interface.
Today, Spark can use with Kubernetes, Apache Mesos, Hadoop, standalone, or in the cloud. In addition, these four languages; Java, Scala, Python, and R—offer high-level APIs for writing Spark code.
The machine learning component of Spark, called MLlib, helps process big data.
Microsoft makes the business data analytics tool Power BI. It offers interactive visualizations with self-service business intelligence capabilities, allowing end users to create dashboards and reports independently without needing assistance.
Power BI recently developed solutions for customers to analyze, link, and safeguard data across different Office platforms, including Azure + Power BI and Office 365 + Power BI.
A free and open-source data analysis, reporting, and integration platform created for analytics on a GUI-based workflow is called KNIME, also known as Konstanz Information Miner.
Enterprises use the KNIME Server platform to deliver Data Science workflows and for team communication, management, and automation.
With RapidMiner 9.6, full-time programmers and BI users can now use the platform. Data preparation, machine learning, and operating model use are all made possible by this open, end-to-end data science platform.
With RapidMiner 9.6, the platform now has full-time programmers and BI users. It is an open, end-to-end data science platform that makes it possible to prepare data and use machine learning and operating models.
Using Microsoft Excel, you can improve your data insights. Microsoft Excel, one of the most widely used data analytics tools, allows users to share workbooks, collaborate on the most recent version in real time, and instantly insert data from images into Excel.
A select few of the performances are free for one month. In addition, there are numerous variations of each of these products, with unique features and price ranges. Almost all businesses use Microsoft Excel to derive actionable insights from their data. IKEA, Marriott, and McDonald’s are a few well-known brands.
Having read this blog, I hope you have gained a clear understanding of some of the top data analytics tools you can use today. The success of your data analytics journey depends on finding the right tool and moving forward with it. First, you must understand your and your organization’s data needs; then, you must research the available tools and decide based on that.
If every question above has been answered, you can choose which tools are most appropriate for your needs.

More on Technology